
The Psychiatric Inpatient Experience (PIX) Survey is a standardized patient experience measure adopted by the Centers for Medicare & Medicaid Services (CMS) as part of the Inpatient Psychiatric Facility Quality Reporting (IPFQR) Program[1]. Beginning with mandatory reporting for 2026 discharges, PIX results will be publicly reported.
PIX organizes patient experience across 23 items into an overall score and four domains, where each item is rated ’strongly agree’ to ’strongly disagree’ or ‘does not apply’. To understand how well this framework works, we examined whether patients’ responses supported the proposed domains and how well individual questions measured different degrees of patient experience ratings.
We conducted factor analysis and item response theory analysis using 51,357 patient surveys from 224 facilities collected between January and June 2026. Factor analysis examined how the questions grouped together, while item response theory examined the strength and performance of individual questions.
Do PIX responses support the four proposed domains?
Broadly, yes. Results supported four domains consistent with the original PIX framework: Treatment Team Relationship, Nursing Team Presence, Treatment Effectiveness, and Environment. Although other statistical groupings were possible, the four-domain structure provided the clearest and most practical interpretation.
Responses were highly positive across PIX items
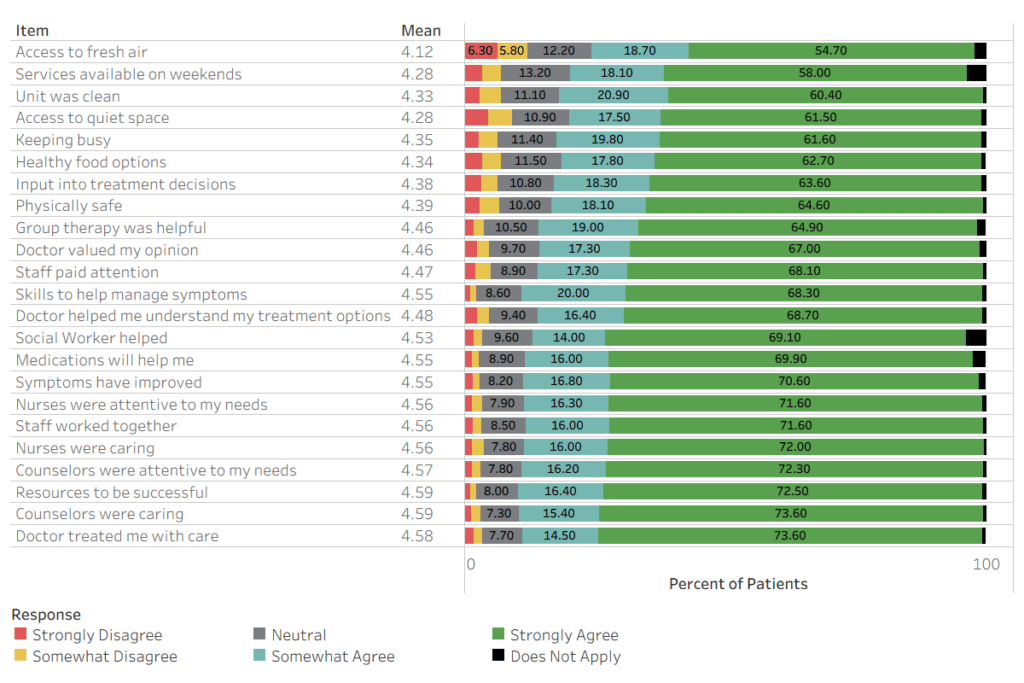
Responses were strongly concentrated at the positive end of the rating scale across all survey items. For most questions, “Strongly agree” was the most common response, often selected by more than 60% of patients and resulting in high average item scores.
Figure 1. Mean And Distribution of PIX Item Scores (Non-Interactive Graph)
Which PIX items best distinguish between patients with higher and lower rated experiences?
Most items were clearly related to patients’ experience within the item’s larger domain: patients with more positive domain experiences generally selected more positive responses. This relationship was strongest for questions about the Treatment Team Relationship and Nursing Team Presence. Several Environment items, “Access to fresh air”, “Food”, “Cleanliness” or “Access to quiet places” did not necessarily become more positive as patients’ underlying ratings in the Environmental domain increased (compared to other domains). This does not mean that these aspects of the treatment environment are unimportant. Instead, these items may capture specific features of environment that do not always change together. For example, a patient may rate cleanliness highly while rating other “Environment” items low.
The survey is most sensitive to differences in lower experience scores
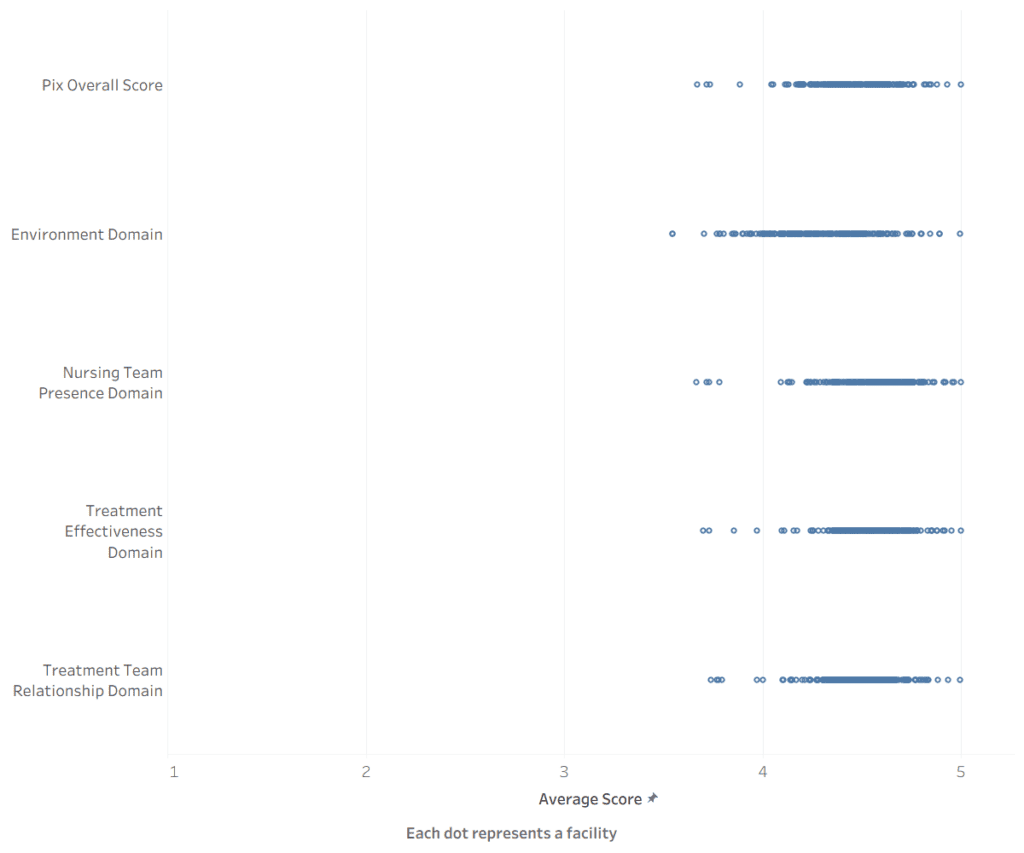
Across all four domains, patient responses followed a similar pattern. Patients gave increasingly positive item ratings as their domain experience improved, however this was only the case when they rated the domain below average. Once their domain rating was approximately average, their item ratings changed very little because most patients were already choosing the highest rating available. This means the survey is useful for identifying differences among patients with poorer experiences, but it is less able to distinguish between good, very good, and excellent experiences. This limitation is known as a ceiling effect. As a result, PIX may provide limited insight into how facilities can improve an already positive patient experience from good to excellent. Further, results may not allow for differentiating between facilities providing good, very good, or truly excellent patient experience.
Figure 2. Distribution of average facility PIX scores (Non-Interactive Graph)
Most questions captured distinct aspects of the patient’s experience.
For a few pairs of questions, patients who gave a more positive rating to one question also tended to give a more positive rating to the other question, with a relationship beyond what would be expected based on the items’ domain score. This suggests these questions may be capturing similar experiences and providing some overlapping information. The strongest relationships are shown in Figure 3.
Figure 3. PIX items with the strongest within-domain relationships
| Domain | Item 1 | Item 2 |
| Nursing Team Presence | Nurses were attentive to my needs | Nurses were caring |
| Nursing Team Presence | Counselors were attentive to my needs | Counselors were caring |
| Nursing Team Presence | Staff worked together | Staff paid attention |
| Treatment Team Relationship | Input into treatment decisions | Social Worker helped |
These findings have important implications for interpreting and using PIX scores.
- Look beyond the overall score. Domain and item level scores can reveal specific strengths and opportunities for improvement.
- Review Environment questions individually. They capture more distinct aspects of care that may not closely follow the broader Environment domain score.
- Interpret high scores carefully. Ceiling effects make less positive experiences easier to distinguish than highly positive ones.
- Most items add unique information. Only four pairs appeared to capture closely related experiences.
References
[1] Klemanski, D. H., Barnes, T., Bautista, C., Tancreti, C., Klink, B., & Dix, E. (2022). Development and validation of the Psychiatric Inpatient Experience (PIX) Survey: A novel measure of patient experience quality improvement. Journal of Patient Experience, 9. https://doi.org/10.1177/23743735221105671


