It is widely accepted that the severity of a unit’s patients can shape everything from staffing decisions to treatment approaches. Further, a facility that tends to have patients with comparatively lower admission severity on outcomes tools is likely to have a lower average change score since their patients have less room for improvement. Because the opposite is also true for facilities with more severe patients, benchmarking and comparative performance that is based on change scores is challenging. Using the percent of patients who improve rather than an average change score avoids this and other potential issues when understanding and communicating your facility’s performance (see MHO’s “Clarifying Communication around Patient Improvement”). Still, though, there is value in understanding the admitting severity and case mix of your patients, and conversations with client facilities suggest there is great interest in using data to support claims around having more severe patients than other facilities. This led us to investigate the distribution of “high admission severity” patients across individual facilities.
We started by comparing each admission score for a patient to all other admission scores on the same clinical assessment for patients in the same age group and level of care. If the score was in the top 25%, the patient was considered “high admission severity” for that particular assessment. If a patient was high severity on at least one assessment, they were also considered “high admission severity” on any assessment.
We then calculated the following percentages for facilities with 30 or more admission scores in the year 2024:
- % of patients with high admission severity on any clinical outcome
- % of patients with high admission severity on specific clinical assessments (BASIS-32, PHQ-9, and CABA each separately)
When a facility has more than approximately 25% of patients in the “high admission severity” group for a specific assessment, data support the idea their patients admit with comparatively higher admission severity, whereas those with less than approximately 25% seem to have patients with comparatively less severity. For this analysis, we evaluated how many facilities had percentages at least 1.5x or 2x the expected rate of 25% (i.e., 37.5% or more, and 50% or more; Figure 1).
Figure 1. (Not Interactive) As few as 3% and up to 21% of facilities have patients admitting with high severity more often than expected, indicating they may serve a more severe population.
Clinical Assessment |
# of Facilities Evaluated |
% of Facilities with… |
|
37.5+% high severity patients |
50+% high severity patients |
||
Any Assessment |
275 |
21.50% |
9.10% |
BASIS-32 |
161 |
11.20% |
3.70% |
PHQ-9 |
108 |
15.70% |
2.80% |
CABA-Y |
155 |
4.50% |
9.70% |
Figure 2. (Interactive) By facility and clinical assessment, percent of patients with high admission severity.
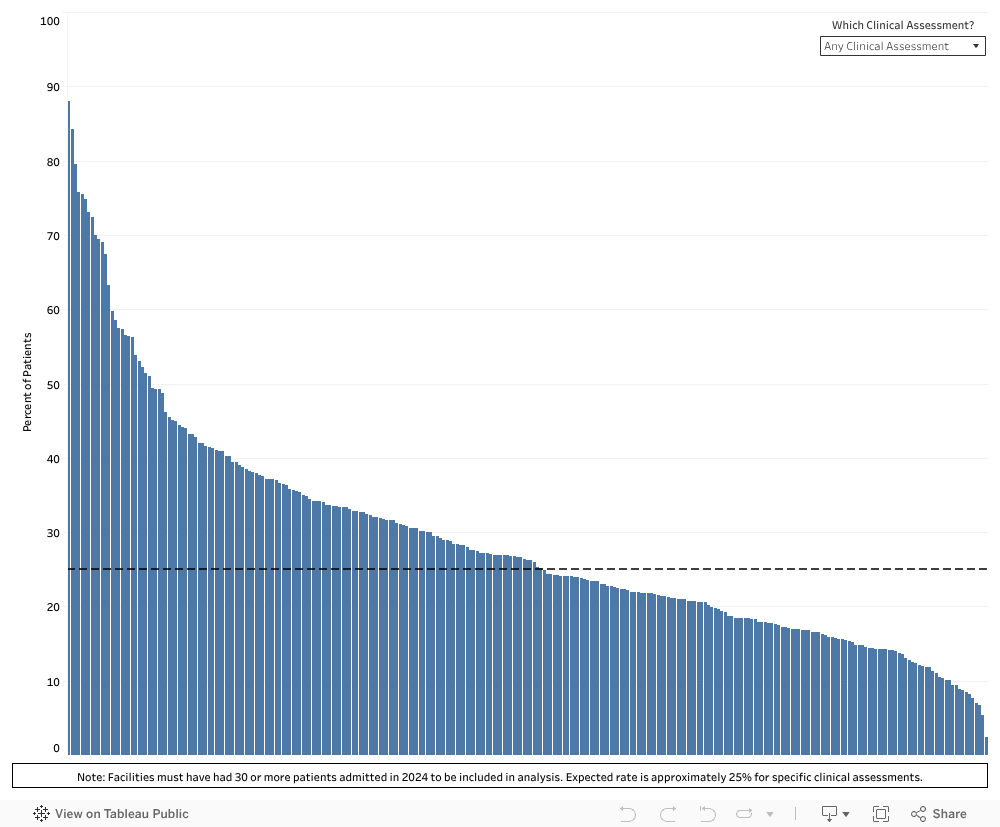
As expected, most facilities’ patients admit with high admission severity at a reasonably expected rate. For those with higher than expected rates, remember, though, the percent of patients considered “high admission severity” is simply one indicator of case mix meant to support a facility in treating its patients; it is not the be all and end all of indicators, nor is it by itself a reflection of the facility’s performance. Still, understanding the percentage of patients admitted to your facility with high admission severity, can assist with:
- Benchmarking: see how your facility stacks up against others in treating high-severity cases.
- Treatment Strategies: adjust interventions based on the complexity of your patient populations.
- Operational Planning: allocate resources more effectively – if you’re admitting more severe cases, you may need specialized staff or longer treatment timelines.
Keep an eye out for “high admission severity” in current and future reports – it can add valuable context to evaluating patient and program success!